Data Visualization Services


Data Visualization Services that Visualize Your Data for Clear Insights
Our Data Visualization Services help you understand your data better by turning it into clear and easy-to-read visuals. With colorful charts and user-friendly dashboards, Biexpetz makes it easy for you to see patterns and make informed decisions.
Gain Competitive Advantage through Data Visualization Consultancy
A data visualization consulting service can give your business a big edge in making informed decisions. Biexpertz gives you insights that help you make strategic decisions and drive growth by turning raw data into useful visuals. Our data visualization company doesn't just figure out what the numbers mean; it also gives you a clear picture of your business, showing you possibilities and telling you what to do.
Why Choose Biexpetz as Your Data Visualization Agency?
- Established in 1997, providing reliable service for over two decades.
- Customizable turnaround time, with options as fast as 24 hours.
- Recognized as a leading provider of Business Intelligence (BI) services.
- Serving businesses across all industries, without limitations.
- Team of skilled data visualizers offering expert Data Visualization As A Service
- Proficient in utilizing tools from industry leaders such as Microsoft, Amazon, and Oracle.
- Praised for exceptional customer service, prioritizing quality, and meeting individual needs.
Expertly Handled Cases by Our Data Visualization Expert Team.
Our data visualization firm has strategically assembled a team of experts from diverse backgrounds worldwide, each specializing in specific cases. This ensures that your data and business are in safe hands, free from any risk.
Financial Data Analysis
Our data visualization agency experts meticulously analyze financial data, providing actionable insights to drive informed decision-making. We uncover trends and patterns using advanced statistical methods and visualization techniques, helping you optimize financial performance.

Market Research Visualization
Leveraging cutting-edge visualization tools, we transform complex market data into clear, understandable visuals. Our data visualization expert team distills vast amounts of information into key insights, enabling you to confidently identify market opportunities and make strategic decisions.

Healthcare Data Visualization
With a focus on healthcare, our data visualization agency visualizes medical data to streamline healthcare operations. Through interactive dashboards and visual representations, we facilitate data-driven decision-making to improve healthcare sector outcomes and efficiency.

Supply Chain Analytics
Our data visualization firm streamlines supply chain processes by analyzing data and visualizing critical insights. From demand forecasting to inventory management, our data visualization expert team identifies inefficiencies and optimizes workflows, ensuring smooth operations and cost savings throughout the supply chain.

Customer Behavior Analysis
Our data visualization consultant team examines customer data to understand behavior and preferences, enabling personalized marketing strategies and enhanced customer experiences. We help businesses anticipate customer needs and drive loyalty through segmentation analysis and predictive modeling.

Social Media Insights
By mining social media data, we uncover valuable insights into audience sentiment, engagement trends, and competitive analysis. Our data visualization firm provides actionable recommendations for social media marketing strategies through visualizations, helping businesses leverage the power of social media effectively.

Risk Management Visualization
We assist businesses in identifying and mitigating risks through comprehensive data visualization. Visualizing risk factors and scenarios enables proactive risk management strategies, safeguarding businesses against potential threats and uncertainties.

Techniques We Utilize at Our Data Visualization Agency
- Symbol Maps
- Bar Charts
- Line Charts
- Pie Charts
- Heat Maps
- Scatter Plots
- Histograms
- Tree Maps
- Box Plots
- Network Diagrams
- Choropleth Maps
- Gantt Charts
- Waterfall Charts
- Radar Charts
- Word Clouds
- Sankey Diagrams
- Pareto Charts
- Bubble Charts
- Bullet Graphs
- Pictograms
- Streamgraphs
- Matrices
- Parallel Coordinates
- Sunburst Charts
- Error Bars
- Box-and-Whisker Plots
- Hexbin Plots
- Violin Plots
- Sparklines
- Dendrograms
- Contour Plots
Why Choose Biexpertz as a Business Intelligence Bi Consultant?
Choosing Biexpertz for Business Intelligence consultancy is the smart choice for your business. With our expertise in Power Bi consultancy, we provide solutions that seamlessly integrate with your operations and empower your decision-making. Leave the complexities to us – we handle them confidently, ensuring that reliable data informs every decision you make.
Our Past Data Visualization As A Service Projects
Financial Dashboard for Global Investments Inc.
Details : We developed an interactive financial dashboard to track key performance indicators (KPIs) and monitor financial health.
Technologies Used : Tableau, SQL, Python
Impact : It provided actionable insights for strategic planning and product development, resulting in enhanced market competitiveness.
Market Research Visualization for Tech Innovations Co.
Details : We created visualizations to analyze market trends, consumer behavior, and competitor performance.
Technologies Used : Power BI, Excel, R
Impact : It enabled real-time analysis of financial data, leading to improved decision-making and increased profitability.
Customer Segmentation Analysis for Retail Dynamics Corporation
Details : We conducted customer segmentation analysis to identify distinct customer groups and personalize marketing strategies.
Technologies Used : SAS Visual Analytics, R, SQL
Impact : It enhanced targeted marketing efforts, improved customer engagement, and boosted sales revenue for Retail Dynamics Corporation.
Healthcare Analytics Platform for Regional Hospital Network
Details : Our team built a comprehensive analytics platform to optimize patient care, resource allocation, and operational efficiency.
Technologies Used : Qlik Sense, Python, SQL
Impact : This platform improved patient outcomes, reduced costs, and streamlined operations through data-driven insights and decision-making.
Supply Chain Optimization for Logistics Solutions Ltd.
Details : We implemented data-driven solutions to optimize inventory management, logistics planning, and supplier relationships.
Technologies Used : D3.js, Excel, Python
Impact : This reduced supply chain costs, minimized stockouts, and improved delivery efficiency, leading to increased customer satisfaction.
Customer Segmentation Analysis for Retail Dynamics Corporation.
Details : We conducted customer segmentation analysis to identify distinct customer groups and personalize marketing strategies.
Technologies Used : SAS Visual Analytics, R, SQL
Impact : It enhanced targeted marketing efforts, improved customer engagement, and boosted sales revenue for Retail Dynamics Corporation.
Here's the List of Data Visualization We Offer
Personalized Report and Dashboard Development
We specialize in creating custom reports and dashboards that match your unique needs. We'll sit down with you to understand exactly what information you want to see. Using the best tools available, we'll design reports and dashboards highlighting your business's most important data. Our data visualization consultancy aims to give you clear insights at a glance, empowering you to make confident decisions.
Data Analytics and BI Tools to Make Your Data Work
Our data visualization firm is here to build data solutions that perfectly fit your needs. That means we'll handle everything, from gathering your data to keeping it safe. We'll set up processes to collect and transform your data (ETL/ELT), create a central place to store it all and build special cubes for analysis. Plus, we'll make sure your data stays safe and secure.
Optimizing Your Data Visuals for Impact
Our data visualization consultant team specializes in optimizing your data visualizations to ensure they're as effective as possible. We'll review your existing visuals and identify areas for improvement. Whether enhancing clarity, improving interactivity, or refining the overall design, we'll ensure your data visuals grab attention and convey information clearly.
Our Streamlined Approach for Data Visualization Consulting Services
Discovery & Consultation
In this initial phase, we take the time to understand your unique requirements and objectives. Through in-depth consultations, we delve into your business goals, data sources, and desired outcomes. This step sets the foundation for successful data visualization consulting services as it ensures alignment and clarity on project expectations.

Data Gathering & Analysis
Once we've defined the scope and objectives of the data visualization solution, we proceed to gather and analyze your data. This involves collecting relevant data sources, assessing their quality and completeness, and performing thorough analysis to extract meaningful insights. By diving deep into your data, we uncover valuable patterns and trends that inform our visualization strategy.

Visualization Design and Development
With insights gained from data analysis, we move on to design and develop visualizations tailored to your needs. Our data visualization consultancy team utilizes industry-leading tools and techniques to create clear, intuitive visualizations that effectively communicate key insights. From interactive dashboards to detailed reports, we ensure that our visualizations empower you to make informed decisions.

Feedback & Iteration
Collaboration doesn't end with the delivery of visualizations. We value your feedback and insights throughout the process. This iterative approach allows us to refine and improve the visualizations based on your input, ensuring that the final product meets your expectations and drives actionable insights for your business.

How We Make Data and Reporting Easier for Businesses
Sorting Out Complex Data
Businesses often deal with data from different sources, making it hard to manage and understand. Our data visualization company simplifies things by bringing all your data together and making it easy to understand.
Saving Time on Reporting
Reporting can take up a lot of time, especially when it's done manually. We help you save time by automating the reporting process. That means you get your reports faster, without all the hassle.
Getting Useful Insights from Reports
Reports are only helpful if they give you useful information. Our data visualization consulting services providers make sure your reports are easy to understand and full of useful insights. That way, you can make better decisions for your business.
Keeping Your Data Safe
Keeping your data safe is important, especially with all the regulations out there. Our data visualization company takes care of that for you by making sure your data is secure and that we follow all the rules. You can trust us to keep your data safe and sound.
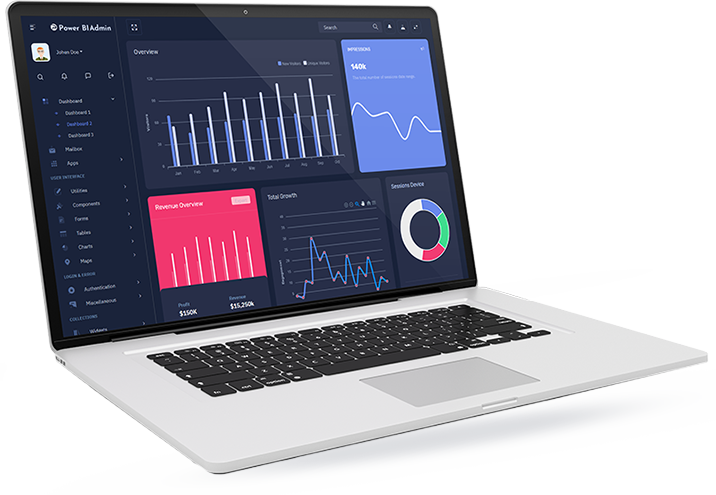
How Our BI Solutions Transformed Our Clients’ Businesses
Ready To Take the Next Step Toward Data Success?
Contact Biexpertz today to explore how our data visualization services can drive growth and innovation for your business. Let's unlock the full potential of a data visualization solution together!
